 Free modern intranet guide
Unlock the full potential of your workforce with a modern intranet

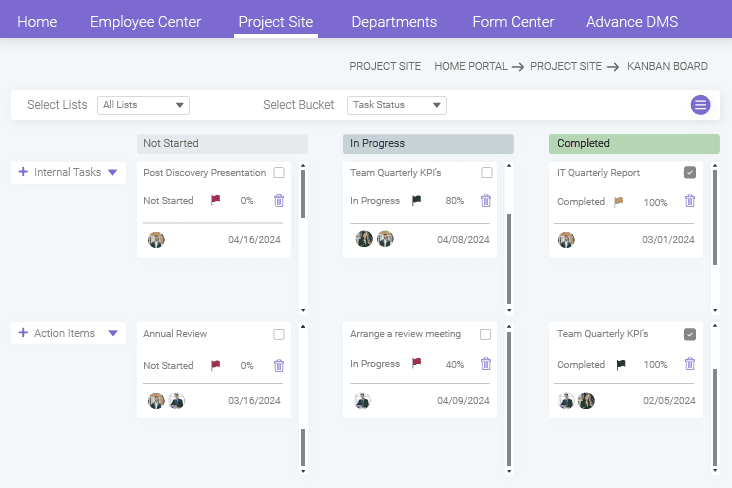
Monitor tasks at their various stages from start to finish. Get a dedicated space to track and manage action items, backlog items, risks, and issues, ensuring that nothing slips through the cracks.
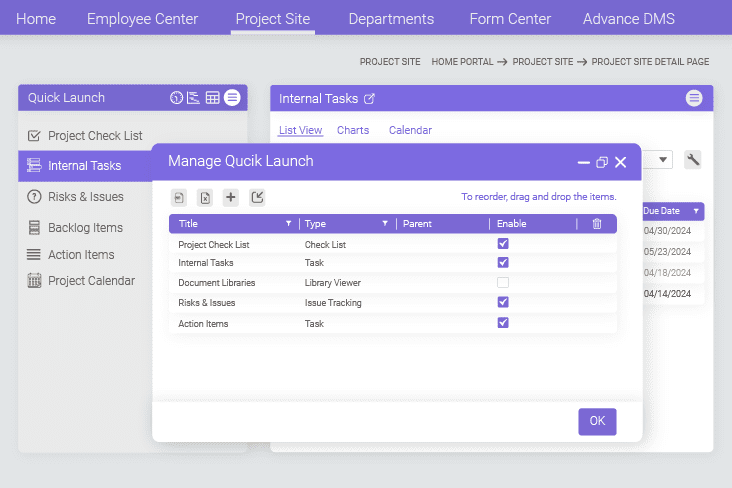
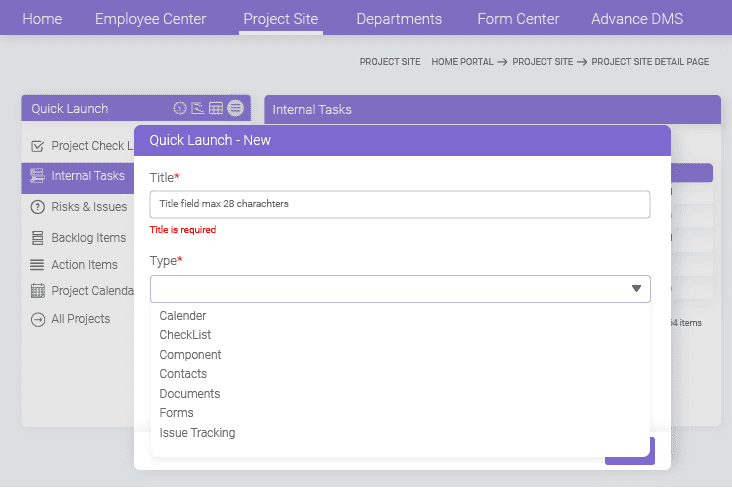
Explore multiple lists in the quick launch window. From a generic list where you can define your own columns to creating dedicated lists to track events, checklists, contacts, and documents, you can track them all in one place.
Gain in-depth insight into task and resource distribution using the interactive card feature for better collaboration and transparency. Adjust your bucket list view based on lists, status, and priority filters.
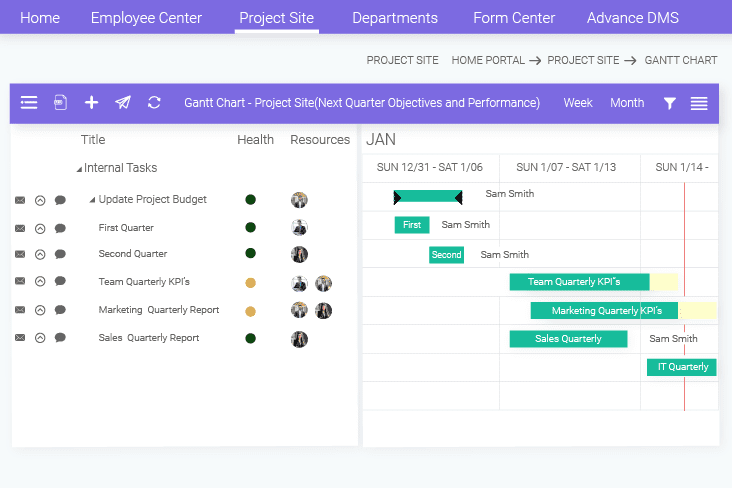
Interactive bar chart view of allocated tasks with integrated Start-to-Start and Finish-to-Start task dependencies to keep you ahead of deadlines. Easily monitor health, status, start and end dates, and resources assigned to the task.
A dedicated information display area to view, edit, update, and manage items stored in multiple lists. Utilize lists, pie charts, and calendar views to present task time spans more effectively.
Free modern intranet guide
Unlock the full potential of your workforce with a modern intranet
About BizPortals Solutions
Company
Product